One of the main columns in our dataset is the column labeled “Area.name”. This column gives each observation (crime) a rough location as to where the crime was located, based on the location of the police station that had reported the crime. Within Los Angeles, there are 21 different police stations or “divisions”, each representing a different region of LA. Given this column, we wanted to explore some analytics about the amount of crime present within each division. What is the rough population of this division, and how much does population correlate to crime rate? What is the size of each region, and can a smaller sized region lead to an eventual higher crime rate? These are questions that we wanted to explore in this section, and we have created several different visualizations to accommodate them.
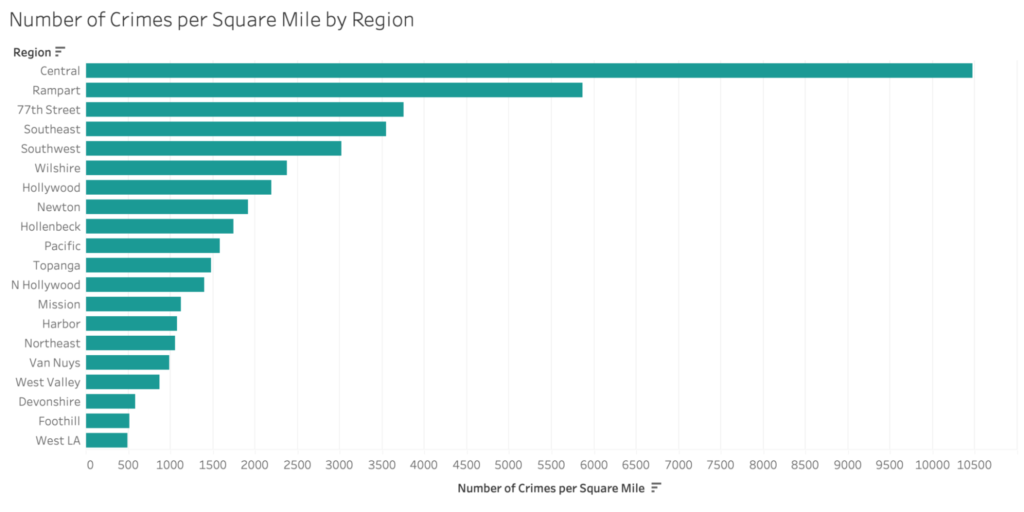
We first wanted to explore each of the 21 different areas, and see whether or not there was a drastic correlation between some of the areas and the amount of crime. However, this problem was not as straightforward as simply tallying up the total number of crimes in each area and comparing them to one another. The reason for this is the drastic differences in size between each of the different areas within Los Angeles. For example, we cannot compare the number of crimes that have occurred within California with the number of crimes that have occurred in Rhode Island, as California is a much larger state, and would easily have a much larger number of crimes when compared to Rhode Island. However, this doesn’t mean that California has proportionately more crime than Rhode Island. Because of this, it is important to compare the amount of crime per square mile for each area, as this is a way to “standardize” a metric such that each area is comparable. After performing external research on each LAPD Division at the LAPD website (https://www.lapdonline.org/lapd-organization-chart/), we were able to find out the size in square miles that each division essentially “covers” throughout Los Angeles. We then calculated the amount of crime per square mile over the three year period of the data (2020-2023) and graphed our results in a bar chart show here:

From this bar chart, we can find out many insightful pieces of information about the different divisions in LAPD. We see that the “Central”, “Rampart”, and “77th Street” divisions are the most crime dense within Los Angeles, while the “West LA”, “Foothill”, and “Devonshire” divisions are the least crime dense. This bar graph allows us to take a look closer at specific LAPD divisions and make further analysis on what may potentially be going right or wrong in terms of crime.
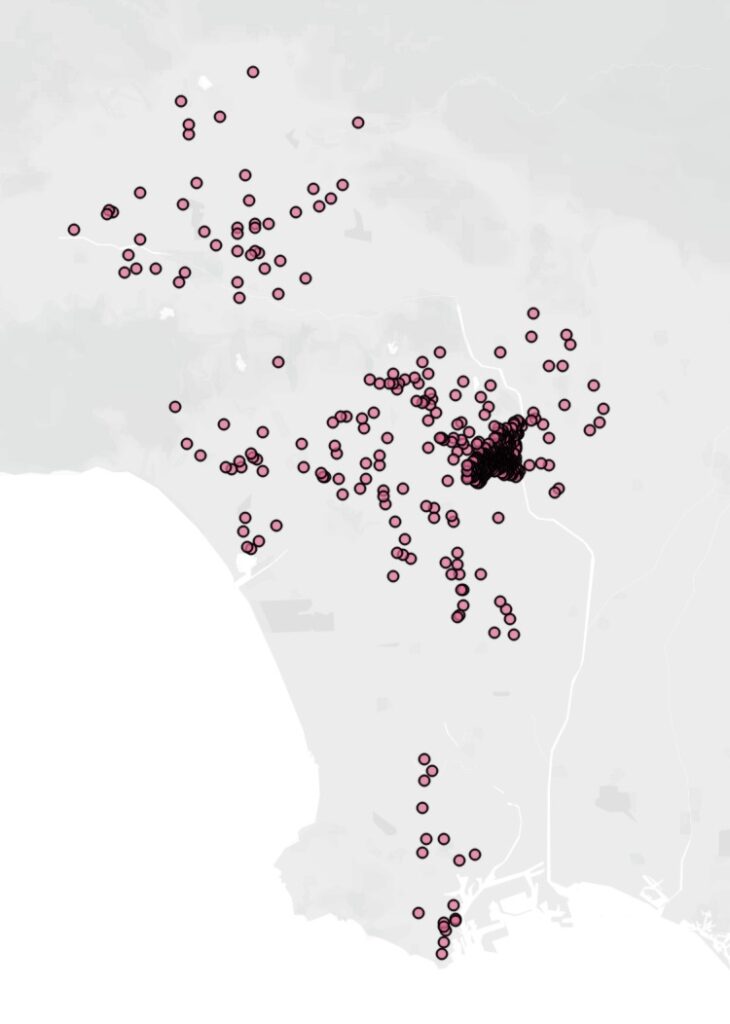
If we actually graph a randomly sampled 1,000 crimes of our data on a map, we can definitely see a correlation that is similar to that of the bar chart.
Map of Random 1000 Crimes in Our Data

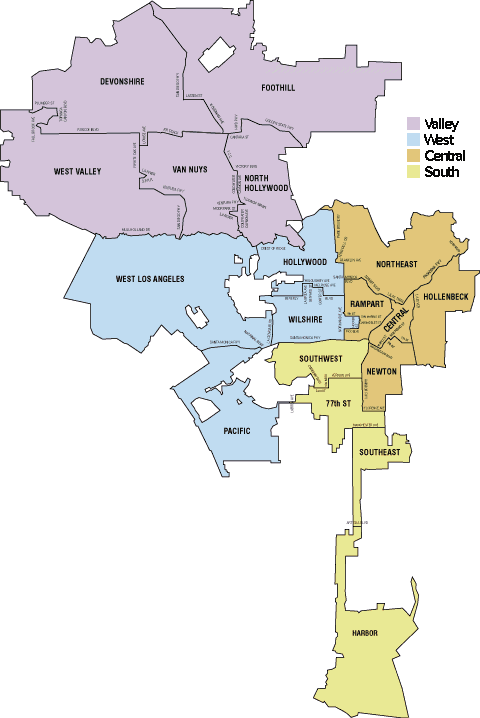
Map of 21 LA Divisions (from earlier)

As you can see, there are definitely areas in Central and Rampart that are a lot more crime dense than areas in West LA, Foothill, Devonshire, etc. This map captures the same meaning as the bar chart shown earlier, and really highlights which parts of LA may need to be worked on and monitored more closely.
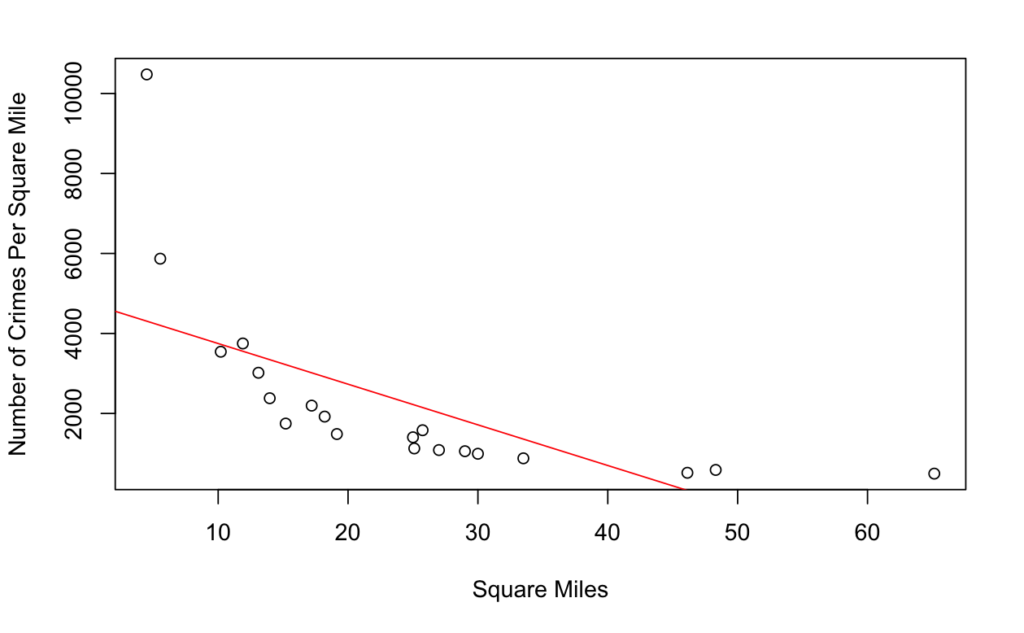
We also wanted to see if the smaller regions could potentially lead to more crime. Once again, we can only do this by comparing the crimes per square mile, and not the total number of crimes. In order to analyze this, we wanted to graph the number of crimes per square mile (what we calculated for the previous graph) against the square miles for the corresponding region.

After graphing these points and drawing a best fit line through the data, you can clearly see that there is a negative correlation between square miles and number of crimes per square mile. What does this suggest? It suggests that the larger an area is, the less crime dense the area will most likely be. In other words, the most crime-dense areas are generally the smaller areas, and Los Angeles should be wary about the amount of crime that may potentially occur in their smaller regions.